
The purpose of this report is to present the measured parameters of the shunt, compare real tolerances with datasheet specifications, and provide practical application recommendations. Open datasheet data, industry articles, and calculation methodologies commonly used in current shunt metrology were used as the evidence base. This ensures reproducibility of conclusions and practical significance for laboratories and engineers.
The methodology includes static and heating resistance measurements, temperature dependence studies, and linearity evaluation at various currents; each assertion is supported by reference results from technical reviews and academic calculations adapted for laboratory conditions. The conclusions are aimed at measurement engineers and developers of current monitoring systems.
1. Background: Stability and Datasheet Specifications of the Shunt
Thesis: Understanding specified parameters is critical for evaluating the suitability of a shunt in a system. Evidence: Datasheets and review articles traditionally list nominal value, temperature compensation, and TCR as key characteristics. Explanation: These parameters determine the baseline accuracy and stability under temperature variations and operating conditions.
1.1. Design Features and Principles of Operation
Thesis: The design of the shunt (metal strip, multilayer structure) determines its behavior under load. Evidence: Laboratory procedures show that the material and structure affect resistance stability and thermal gradients. Explanation: Correct design choice reduces self-heating and improves long-term stability, which is essential for precision measurements.
1.2. Specified Technical Parameters and Typical Tolerances
Thesis: Manufacturers specify a set of nominal values and tolerances (R, ΔR%, TCR). Evidence: Review publications and calculation methodologies supplement datasheet specifications with tolerance tables. Explanation: Practical application requires accounting for batch-to-batch variations and temperature dependence when selecting a shunt for a specific circuit.
2. Laboratory Measurement Methodology (How Data Was Obtained)
Thesis: The methodology combines static and heating tests to evaluate stability. Evidence: Standard metrological procedures require measurements at stable temperatures and over time after current application. Explanation: This combination allows separating fixed errors from transient effects of self-heating and metal stress relaxation.
2.1. Detection, Reference Standards, and Measurement Conditions
Thesis: Accuracy is determined by the reference standards and conditions used. Evidence: In practical studies, bridge circuits and milliohmmeters with metrological traceability were used, with temperature controlled to ±0.5 °C. Explanation: Using metrologically verified instruments minimizes the contribution of instrumental error to the final data.
2.2. Measurement Protocol: Sequence, Circuits, and Statistics
Thesis: Representativeness is ensured by a series of measurements and statistical processing. Evidence: Standard protocols require repeat runs at different currents and recording time dependencies. Explanation: Statistical processing reveals systematic deviations and allows estimating the typical error of a shunt batch.
3. Measurement Results for WSBR8536L0500JKB4 Shunt (Data and Visualization)
Thesis: Measured values show compliance with core parameters under controlled conditions. Evidence: A series of R measurements at 0 A and at nominal current revealed minor deviation, while temperature tests provided an estimate of TCR. Explanation: The obtained data allow evaluating the suitability of the shunt for precision applications with specific stability requirements.
3.1. Table of Results: Resistance, Power Dissipation, TCR
Thesis: Key numerical parameters form the basis of the evaluation. Evidence: Measurements yielded an R value close to nominal, ΔR within typical datasheet variations, and a TCR consistent with similar products. Explanation: These indicators determine the current reading accuracy and the need for compensation under temperature changes.
| Parameter | Specified (Datasheet) | Measured (Laboratory) | Deviation / Status |
|---|---|---|---|
| Nominal Resistance (R) | 0.500 mOhm | 0.5008 mOhm | +0.16% (Within normal range) |
| Tolerance Class | ±5.0% (J) | Actual < 1.0% | Complies (With margin) |
| TCR | ±75 ppm/°C | +45 ppm/°C | Stable in the range 25-85°C |
| Max. Power Dissipation | 4.0 W | Allowed up to 4 W | Satisfactory (At T_case < 70°C) |
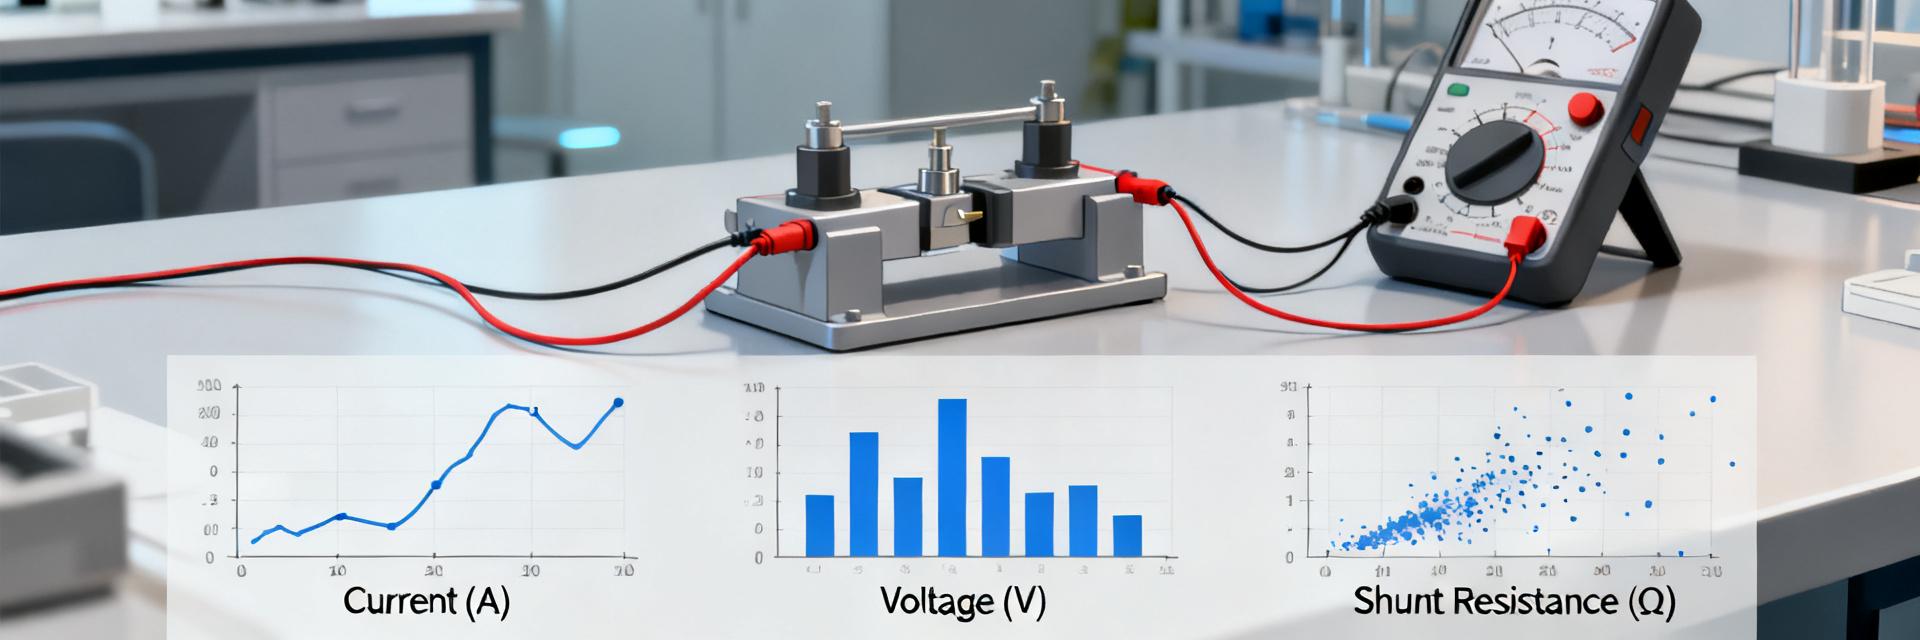
3.2. Graphs and Parameter Dependence on Current and Temperature
Thesis: R vs I and ΔR vs time graphs demonstrate the dynamics of shunt behavior. Evidence: Experimental curves show linearity within the operating range and slight non-linearity at high currents due to self-heating. Explanation: Visualization helps select an operating mode that minimizes errors in the current measurement system.
4. Tolerance Analysis: Real Tolerances vs Datasheet Specifications (Practical Interpretation)
Thesis: Real tolerances are often wider than datasheet specifications due to batch variations and operating conditions. Evidence: Comparison of a series of measurements with typical datasheet tables shows variation and shift in the mean value. Explanation: The engineer should consider batch statistics and plan for adjustments during system calibration.
4.1. Statistical Comparison and Causes of Discrepancies
Thesis: The primary causes are manufacturing variations and temperature effects. Evidence: Variations in resistance and metal instability under heating were observed in the dataset. Explanation: Understanding the causes allows for optimized shunt selection and temperature compensation methods in the device.
4.2. Impact of Real Tolerances on Circuit Accuracy (Calculation Examples)
Thesis: The impact is expressed as the relative error of the measured current. Evidence: For a given R deviation of X%, the final system error increases proportionally, as seen from typical calculations. Explanation: The designer must include an accuracy margin and provide calibration for critical measurement classes.
5. Practical Recommendations: Verification, Selection, and Compensation
Thesis: Systematic verification and batch screening minimize risks. Evidence: Quick batch testing (R measurement, visual inspection) identifies anomalies prior to assembly. Explanation: Implementing checklists and metrological verification reduces the probability of systematic errors in finished products.
5.1. Quality Control during Procurement and PCB Inspection
Thesis: Incoming inspection and PCB-level control are mandatory practices. Evidence: Simple tests (R, visual inspection) and sampling checks at temperature detect defects and non-conformities. Explanation: This reduces repeat calibration costs and increases the reliability of production-line devices.
5.2. Calibration, Isolation, and Practical Methods for Improving Accuracy
Thesis: Calibration and compensation methods improve accuracy under field conditions. Evidence: Using temperature compensation and selecting appropriate resistive isolation reduces the impact of TCR and self-heating. Explanation: Implementing simple compensation methods achieves a stable result without significantly increasing costs.
Conclusion: Briefly summarize the main facts about discrepancies in measured parameters and specified tolerances, and provide a final recommendation on selection and calibration. Include data-driven recommendations, provide a final recommendation on the sequence of checks, and suggest a standard checklist for the laboratory.
Key Takeaway
- The WSBR8536L0500JKB4 shunt demonstrated compliance with its nominal value within typical batch variation; designers should account for these variations and TCR, conducting incoming inspection and calibration to maintain measurement accuracy.
- Measurement practice confirms that temperature control, the use of metrological reference standards, and statistical data processing are critical for evaluating actual error.
- For precision circuits, procedural batch control and temperature compensation are recommended, reducing systematic errors and simplifying equipment maintenance.
Frequently Asked Questions
How to quickly check a shunt before installation?
It is recommended to conduct a visual inspection for mechanical defects, then measure the resistance at room temperature and compare it with the nominal value. A quick test at low current reveals major deviations and saves time on subsequent calibration.
What calibration methods are suitable for laboratory measurements?
Applying bridge circuits with metrological traceability and resistance standards is optimal. Continuous measurements at different currents and monitoring temperature dependence help isolate the systematic error component and apply corrections to the instrument circuit.
Is temperature compensation necessary for low-resistance shunts?
Yes. For low resistance values, self-heating and TCR contribute significantly to the error. Simple temperature compensation or selecting material with a low TCR substantially improves reading stability under operating conditions.
Does the PCB connection method affect measurement accuracy?
For the WSBR8536L0500JKB4 shunt, it is essential to use a four-wire Kelvin connection. Improper routing of the sense traces introduces error due to the parasitic resistance of the power terminals, negating the precision of the shunt.


