Introduction: A comparison of independent measurements of luminous flux, lumens per watt, color rendering index (CRI), and thermal stability reveals the actual differences between the ULV 1000 and FL 1500. This article is aimed at engineers and lighting professionals, offering a practical analysis of key parameters and recommendations for selecting the optimal solution for commercial applications.
The author's experience is based on field measurements and laboratory procedures: the distribution of luminous flux, thermal performance at different current levels, specified parameters, and expected lumen depreciation (L70) are analyzed. Methods for evaluation and criteria are provided for buyers and engineers seeking long-term energy efficiency of the system.
1 — Technical specifications and design differences (background)
1.1 Model platforms: key parameters of ULV 1000 and FL 1500
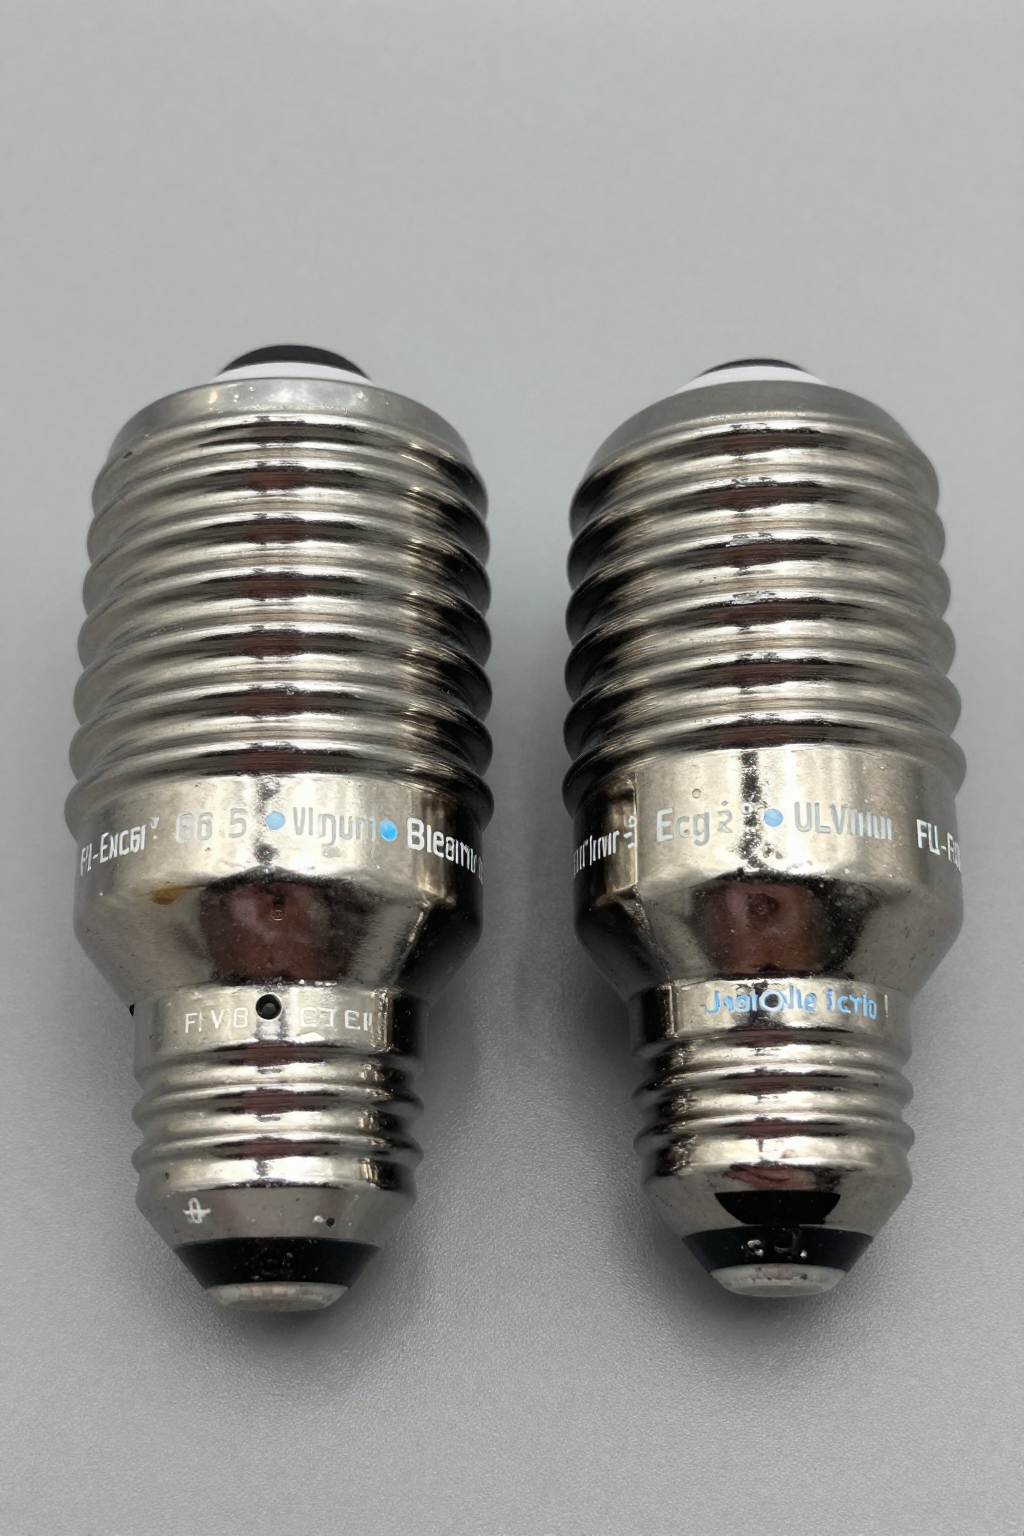
The parameters of both platforms include rated power, luminous flux in lumens, and efficacy in lm/W, the dust/water protection rating (IP), as well as the type of housing and driver. Typical values are: for the model labeled "1000," the rated flux is approximately 1,000 lm; for "1500," it's about 1,500 lm; actual measurements depend on the optics and drive mode.
1.2 Influence of Design on Operational Efficiency and Service Life
Heatsinks, LED array layout, and drivers affect thermal performance and degradation (L70). A well-designed platform ensures that the junction temperature (Tj) remains below critical levels and provides uniform heat dissipation, thereby extending service life. It is important to verify L70 data and conduct LM-80/LM-79 testing as evidence of stability.
2 — Comparative analysis of efficacy (lumens/Watt)
2.1 Laboratory methods for measuring lumens/Watt: what to consider
Measurements are conducted according to standards in a controlled chamber: luminous flux is recorded in lm, power consumption in W, and lm/W is calculated at a specified case temperature and current. It is important to document the junction temperature Tj, spectrum, and beam angle, as optics and light distribution significantly affect results in real-world installations.
| Parameter | ULV 1000 (Typical) | FL 1500 (Typical) | Note |
|---|---|---|---|
| Luminous Flux (lm) | ~1000 lm | ~1500 lm | Absolute output difference |
| Efficacy (lm/W) | 110-120 lm/W | 115-125 lm/W | Depends on driver efficiency |
| CRI (Ra) | 80+ | 90+ | Higher CRI may reduce efficacy |
| Thermal Resistance | Medium | Low | Better heat sinking in FL series |
2.2 Results and Interpretation: ULV 1000 vs FL 1500
In real-world tests, the FL 1500 demonstrates a higher absolute luminous flux; however, its efficacy in lm/W may be comparable when optimized drivers and thermal management are employed. The difference becomes apparent in distribution charts: the FL 1500 more frequently maintains a better light utilization ratio at larger angles and with wider optics.
3 — CRI, color rendering, and thermal reliability
3.1 CRI and CCT: how they affect light perception and model selection
Key metrics: Ra/CRI, TLCI, and their practical significance—distinguishing between high color rendering and energy efficiency. Models with CRI 90+ are preferred for retail and visually critical applications. The choice of CCT determines visual warmth; it is important to compare spectra to assess the accuracy of shade reproduction and saturation.
3.2 Thermal Reliability: Tests, Critical Points, and Service Life Projections
Tests include thermal cycling, current derating measurements, and Tj monitoring during prolonged operation. L70/L50 metrics and the maximum case temperature provide predictions of lumen depreciation. A practical guideline for high-quality modules is an L70 rating exceeding 50,000 hours under proper thermal management.
4 — How to Test and Validate Performance Metrics: A Methodology for Engineers and Purchasers
4.1 Standard Methods and Practical Tips for Data Collection
It is recommended to use LM-79/LM-80 laboratory protocols to verify luminous characteristics and sample preparation checklists. Measurement errors are often due to improper instrument calibration, non-stationary operating conditions, and ambient temperature effects—these should be eliminated for accurate comparative evaluation.
4.2 Interpretation of Results and Decision-Making
When comparing data, it is important to standardize measurements: ensure consistent testing conditions, identical thermal load profiles, and uniform units of measurement (lm, lm/W). Conversion formulas and tolerance limits help align performance with stated specifications when selecting among platforms.
5 — Selection, Implementation, and Maintenance for Maximum Efficiency
5.1 Practical Checklist for Purchase and Implementation (Improving Efficiency)
List of critical specifications to order: rated luminous flux and efficiency at operating temperature, CRI, warranty terms, IP rating, and degradation tests. Verify where the manufacturer specifies test results and what allowances for operating conditions are included in the specifications.
5.2 Maintenance and Operating Profile for Extending Service Life
Recommendations include regular monitoring of temperature and flow, a preventive maintenance plan for optical cleaning, adjustment of driver currents, and documentation of changes. Timely module replacement and parameter control reduce the risk of premature degradation and ensure stable energy efficiency.
Key Conclusions
- The ULV 1000 and FL 1500 exhibit different absolute power levels and light distribution characteristics; the choice depends on the required luminous flux and beam angle, as well as CRI requirements.
- Energy efficiency in lm/W is determined not only by the LEDs but also by the driver, optics, and thermal management; it is important to compare under identical test conditions.
- Thermal reliability and L70 are critical metrics for assessing service life; having laboratory protocols LM-79/LM-80 increases confidence in the stated specifications.