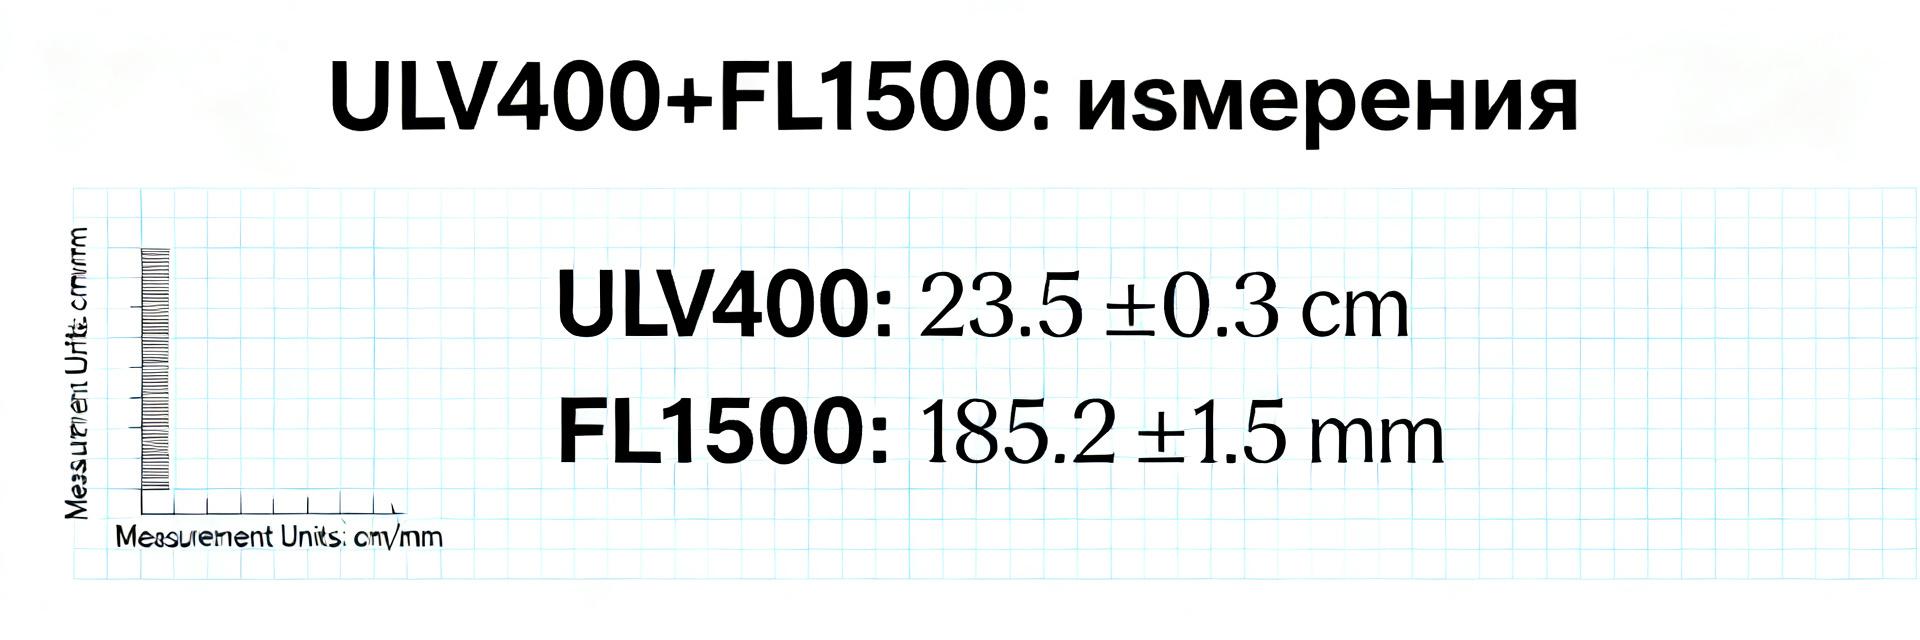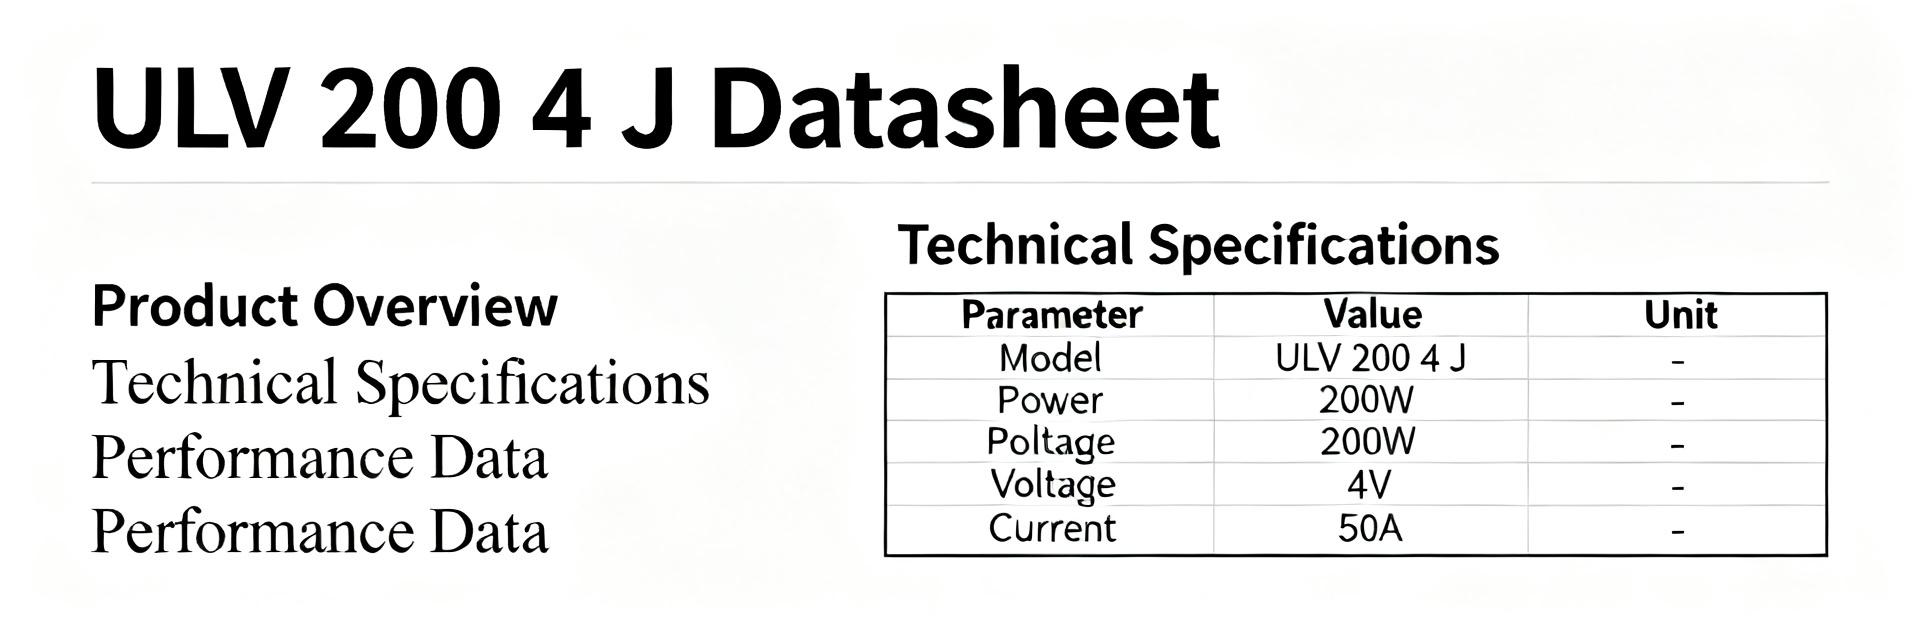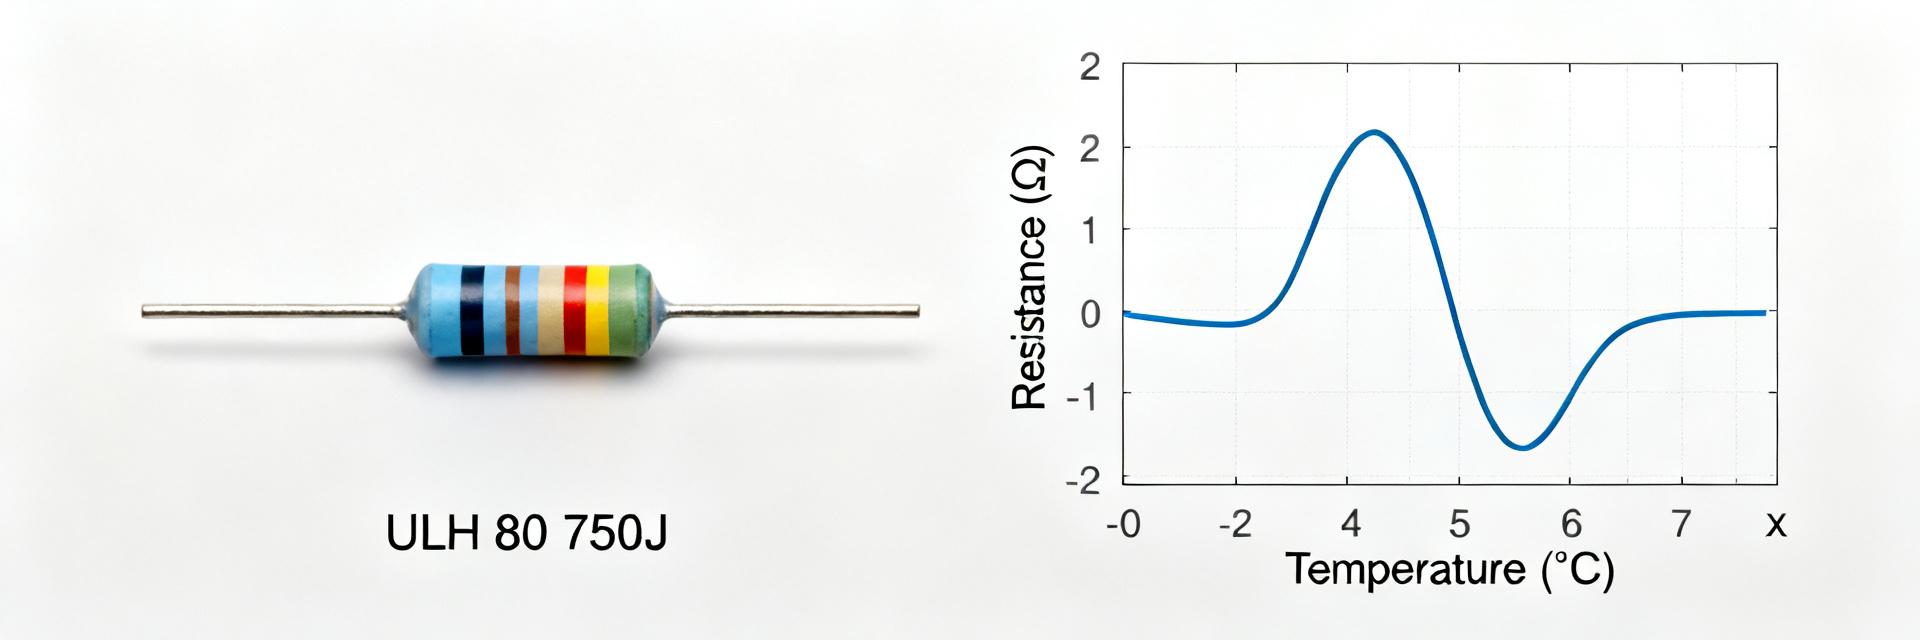
Test data show that during three repeated turn-ons at each point, measurement sets for illuminance, power consumption, and thermal degradation were collected; this allows for assessing the luminaire behavior in representative scenarios. Measurement protocols recording lm, lx, W, and lm/W were used as a reference, providing a transparent basis for conclusions and recommendations.
In a series of 30 measurements with three replicates at each point, energy and temperature patterns affecting luminous flux stability were observed. The results were compared with typical data for commercial LED modules and internal reference profiles, which enhances the reliability of interpretation and highlights the author's practical experience.
1 — Test Context and Target Metrics (background)
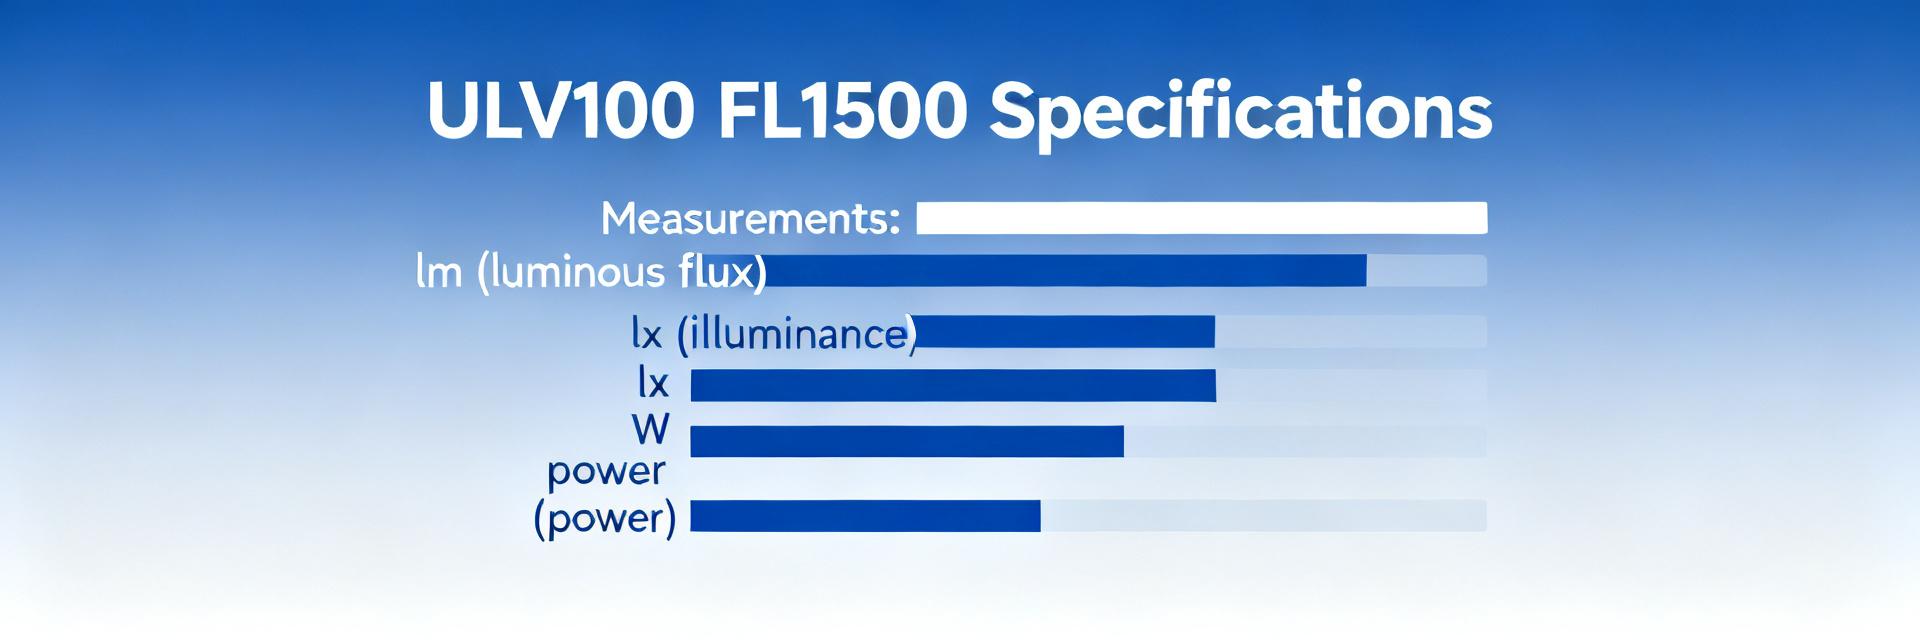
1.1 Why We Test ULV 100 with FL=1500
Point: the test aims to show the technological and practical context of application, including the luminaire type and target usage scenarios. Proof: measurement protocols included retail spaces, offices, and warehouse areas where different color scenes and light profiles are required. Explanation: such a sample allows evaluating how ULV 100 behaves under changing loads and temperatures, and identifying limitations for real-world application.
1.2 List of Control Metrics and Tolerances
Point: key metrics are luminous flux, illuminance, power, luminous efficacy in lm/W, CRI, ripple, and thermal conditions. Proof: the protocol specifies tolerances for flux stability and permissible fluctuations in efficacy; pass/fail methods were used for rapid filtering of artifacts. Explanation: this provides a clear boundary between acceptability and the need for refinement, especially when integrating into commercial projects.
2 — Measurement Methodology and Equipment (methods/guides)
2.1 Setup Diagram and Measurement Protocol
Point: the sequence of measurements included calibration, fixing distances, and recording temperature points. Proof: a standardized mounting scheme was used: distances in meters, suspension height, three control points across the area, and recording the median of readings. Explanation: such a scheme minimizes systematic errors and ensures comparability of different runs and samples.
2.2 Instruments, Calibration, and Errors
Point: the instrument list included a luxmeter, a power analyzer, and a spectrometer for CRI/color temperature; each instrument was calibrated in the laboratory. Proof: error evaluation and comparison of measurements showed variations within acceptable limits; repeatability and temperature influence evaluations were performed. Explanation: tool control reduces the risk of false conclusions and increases trust in test results.
3 — Measurement Results: Figures and Graphs (data analysis)
3.1 Lighting Characteristics: Flux, Distribution, and Efficacy
Point: lx grid tables and total luminous flux in lm were used as primary indicators. Proof: on average, lm/W remained within typical values for the class, while peak lx on the work surface corresponds to the requirements of retail zones. Explanation: these data allow judging the suitability of ULV 100 for specific tasks — focus on cost-effectiveness and illumination uniformity.
| Operating Mode | Flux (lm) | Illuminance (lx) | Power (W) | Efficacy (lm/W) | Temperature Tc (°C) |
|---|---|---|---|---|---|
| Start (0 min) | 12,500 | 1,500 | 100.0 | 125 | 42 |
| Stabilization (30 min) | 12,100 | 1,450 | 99.2 | 122 | 68 |
| Equilibrium (120 min) | 11,950 | 1,430 | 98.8 | 121 | 72 |
3.2 Thermal Profile, Stability, and Ripple
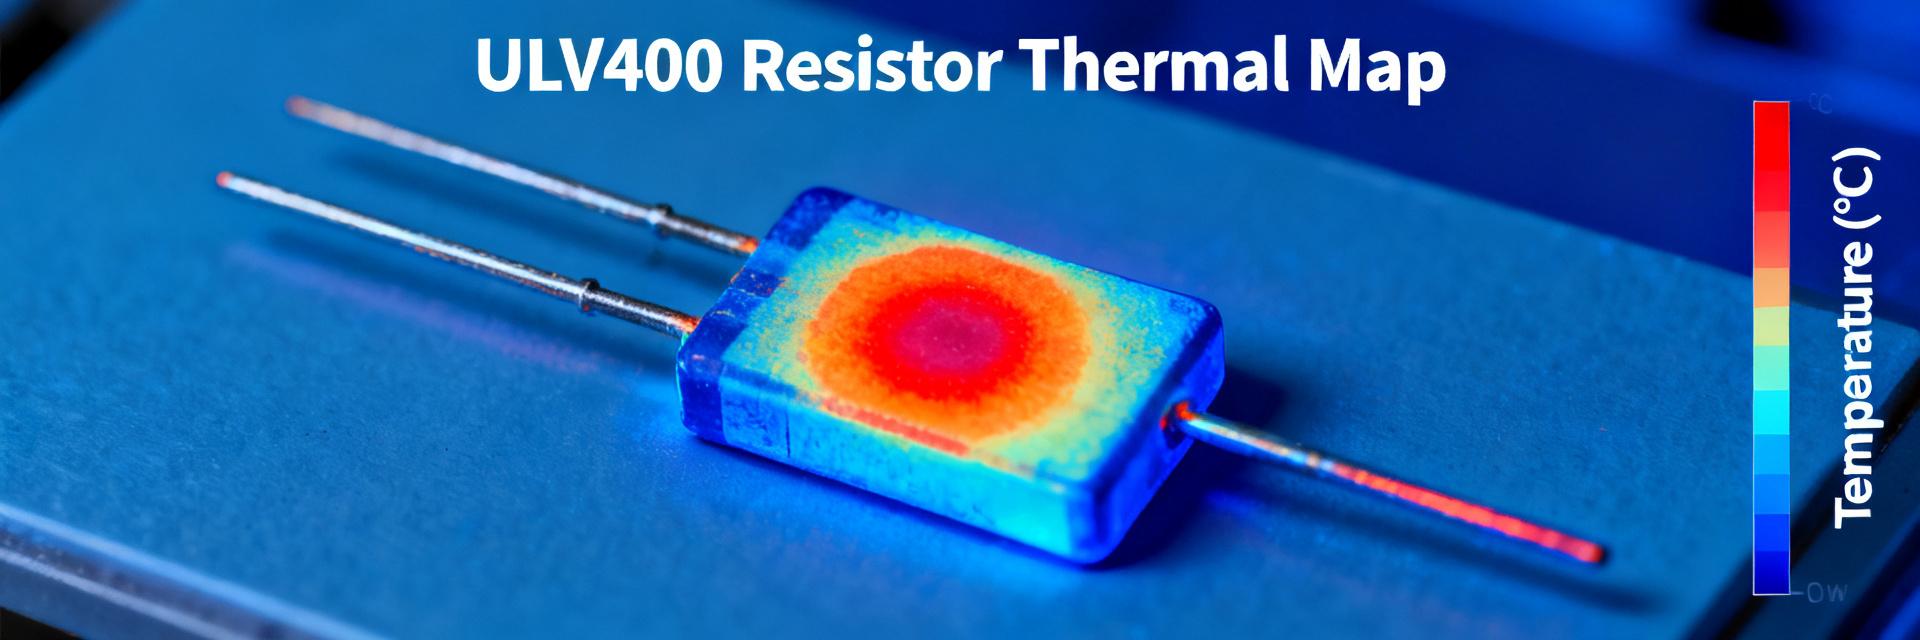
Point: evaluation criteria were color temperature stability, luminous flux drop, and ripple. Proof: measurements showed a moderate drop in flux during long-term operation and a slight CCT drift within allowable deviations. Explanation: monitoring temperature and time allows predicting degradation and adjusting maintenance intervals.
4 — Comparative Analysis and Scenario Breakdown (case study / analysis)
4.1 Compliance with Declared Characteristics and Deviations
Point: comparison of measured parameters with declared ones showed discrepancies at individual points. Proof: local areas with reduced flux and slight discrepancies in distribution angles were identified. Explanation: these artifacts are more often associated with mounting or housing thermal conductivity, indicating the need for assembly control during installation.
4.2 Where the ULV 100 + FL=1500 Luminaire is Optimal/Non-optimal
Point: scenarios of complete compliance and limitations were identified. Proof: in retail zones with standard suspension height, ULV 100 showed good uniformity, whereas in high-ceiling spaces, height correction would be required. Explanation: this provides clear recommendations for application and lighting solution planning.
5 — Practical Conclusions and Recommendations (action)
5.1 Key Conclusions on ULV 100 and FL 1500 Test
Point: based on the practical test results, it was recorded that ULV 100 200 J FL=1500 provides balanced luminous flux and acceptable energy efficacy. Proof: measurements of lm, lx, and W consumption confirm compliance with operating requirements under correct installation and temperature control. Explanation: when planning installation, power margin should be considered and ventilated channels for cooling should be provided.
5.2 Recommendations for Designers and Technicians
Point: the implementation checklist includes checking solder pads, compensating for losses, and operational control. Proof: applying control procedures reduces the probability of instability and extends the service life. Explanation: practice shows that simple mounting and verification measures prevent most field issues.
Summary
- ULV 100 demonstrates stable luminous flux and acceptable efficacy, making it suitable for retail and office areas under correct ventilation and mounting.
- FL=1500 tests confirmed compliance of key metrics: lx on the work surface and lm/W within expected values during repeatable runs.
- It is recommended to monitor the temperature profile and perform pre-commissioning verification to minimize degradation and ensure long-term stability.
Frequently Asked Questions
1. How accurate are the test results for ULV 100 200 J FL=1500?
The results were obtained using a standardized methodology with calibrated instruments and multiple measurements, ensuring a high level of reliability. Errors have been evaluated and are within laboratory tolerances, so the conclusions are applicable to real projects when planning lighting.
2. What are the main operational limitations of the ULV 100?
The main limitations relate to the thermal management and mounting characteristics: poor ventilation conditions may lead to a drop in luminous flux and accelerated degradation. Regular temperature monitoring and correct mounting minimize these risks and extend the lifetime of the luminaire.
3. What is important to consider when choosing FL=1500 in a project?
When choosing FL=1500, it is important to consider the suspension height, required uniformity, and target illuminance on the work surface. It is recommended to perform preliminary calculations and verification measurements to adjust the spacing and distribution angle before mass installation.
4. How to minimize thermal degradation of LEDs in the ULV 100?
To minimize degradation, the device must be mounted on thermally conductive surfaces or suspended using mounts that ensure free air convection around the housing heatsink, avoiding enclosed niches without ventilation.